
Moving your machine learning model into production
- Abdulazeez Abdullah Temitope
- May 1, 2024
- 6 min read


For every machine learning enthusiast, we were told to go to Kaggle. Engage in competitions. But after that, what next? Should it end at just making predictions on the test data and submitting it? Or we would always be supplied with excel sheets to make predictions on with the model in real-life scenarios.
What do we need to do?

Read along to find out what needs to be done.
Background Information
Kowepe Bank of Nigeria conducted marketing campaigns via phone calls with their clients. These campaigns prompt their clients to subscribe to a specific financial product of the bank (term deposit). This survey was conducted with some selected individuals that the bank feels are the best representatives of their clients to minimize the cost of the complete client survey.
You have been contacted as a data scientist to find patterns and build predictive models on this dataset to forecast the percentage of potential customers for the bank’s financial products.
Objective
Identify customers that will subscribe or not.
To start with, you have to 1st import your data.

The next is to do a bit of data exploration. Check for missing values.

Coincidentally everyone filled out the survey entirely, but this is computer-generated data. It doesn’t depict real-life scenarios, as you might have missing values. Please read here on how I handle missing values.
The essence of exploratory analysis (EDA) is to understand your data. Understanding your data is also understanding the distribution of your data. To understand the distribution, we need to run a few statistics. Wrote about the interpretation of these statistics here.

Our descriptive statistics show the presence of outliers. This is better seen visually. The codes below will do that for us.

I’m a lazy guy. Rather than write separate codes to plot the distribution of each variable. I decided to write a for loop, i.e. it loops through each of the items in my numeric_features list created above and then establishes the boxplot for each.

I did the same for my categorical variables, but a bar chart was created.

Another quick hack for EDA is to use pandas profiling. This will create something like a dashboard for your EDA.

Not all columns are necessary for machine learning, even though they are available. You need to find a way to identify which are relevant to your model. One way of doing that is by using a correlation, i.e. those input variables that are correlated with your target variable. Rather than use my intuition, I’d instead give statistics control.
Let’s run a quick check on the data type of all variables.

About 11 columns have the object data type, meaning they are categorical variables, but correlation doesn’t work with strings. Also, machine learning models can’t be created with string variables. Hence we need to convert them into numbers. For conversion, LabelEncoder() is employed. This assigns numbers starting with 0 to the elements in the categorical variables.

Why didn’t we replace them one by one with the replace method? Any guess

If you are moving your model into production, any data processing done before training the model would also have to be done in production. For example, one of the categorical variables is marital status (Married or single). Algorithms can’t work with strings; then, we convert them to 0 and 1. To be able to use this in production, you can’t ask users to input 0 and 1 as marital status. So you would also have to write a line of code to replace the input in production. The lines of code then start becoming bulky.
But with labelencoder() and assigning to marital_encoder variable, it is transforming and storing the mapping. Hence, in production, I need to call the marital_encoder variable.
The data before encoding

The data after encoding

If we check the data info, we will see that only one column has the object type, which is the customer_id, and it will be dropped.
Earlier, I said correlation would determine which column is dropped. So let’s plot a correlation matrix.

The matrix

This seems like a piece of work having to look through which is correlated or not.
As I said, I’m a lazy guy. So let’s define a function that lists the columns whose correlation score is more significant than what we specify.

We are setting a threshold of 0.01.

The score is low, right?

Now that we have identified which columns have an existing relationship. We then go into splitting the data for training the model. We have to first separate the features (x) from the output (y).

Then split the data into train and test data.

Define a function to test the performance of the model

Then the sweet part, Model training.

Logistic Regressor
The first is the Logistic Regression.

Making predictions and testing performance.

Please take a quick look at the matrix and try to understand what it is saying.

We have all heard True Positive, True Negative, False Positive and False Negative. What does this mean? Let’s use the image below to break it down.

True positive — A lady who is pregnant is correctly diagnosed as pregnant
False positive — A man is diagnosed as pregnant, which doesn’t make complete sense. Also known as type 1 error.
False negative — A pregnant lady is incorrectly diagnosed as not being pregnant, also known as a type 2 error.
True negative — The man is diagnosed as not being pregnant. It perfectly makes sense.
The goal is to minimize the amount of both type 1 and type 2 errors in your model.
Random Forest
Let’s train the model

Evaluate the model performance


Support Vector Machine (SVM)
Model training

Performance evaluation


KNN
Model training

Model performance


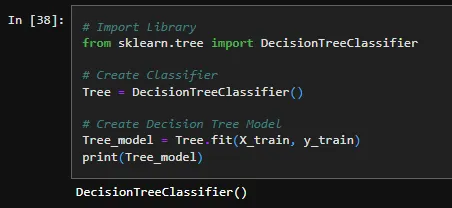
Decision Tree
Model training
Model performance


Gradient Boost Classifier
Model training

Model performance


Out of all models, the Gradient boost performed better. Then, we save the model.

Notice the encoders created during the preprocessing were also saved with the model.
Let’s test the model with data it has not seen before. For this, we would need to load back the saved model.

We load the test data.

The same set of columns used in creating the model is also needed for testing the model.

This is the exciting thing about not using the replace (). If we had done that, we would have had to write it for each column again.

The test data has been transformed. No strings but numbers

Then just call model.predict()

We’ve been able to export the model and then use the exported model on data it has not seen before.

But it doesn’t end here. A model left in your notebook is less beneficial. The goal of building a machine learning model is to solve a problem, and an ML model can only do this when it is actively used in production. So how do we do this?

For educational purposes, you can always use streamlit. I’ve hosted my machine learning apps on Streamlit for over a year, and it’s free.
Let’s take a quick peek at how I moved a model into production. First, we need to load the essential library.

Define a function to load your model and encoder.

Since the model is sorted, we then have to create the outlook of the ml app. We start by defining our categorical variables. In a production environment, users won’t select 0,1 as marital status.

We have grouped our variables. Streamlit gives you several options when designing the front end, but I have stuck with the selectbox (dropdown) and slider. You can play around with others.

Socio-economic variables

Contacts

Others

Once a user selects an option, that selection is stored in the appropriate variable. But if the user selects marital status as single, your model doesn’t understand single; it only understands 0’s and 1’s. Hence the need for transformation, which is the essence of the encoder we loaded with the model.

This is just me designing the front end.

Upload your files to GitHub and connect them to Streamlit and that’s it; you have moved your model from your notebook into production.

Those Kaggle competitions shouldn’t end in your jupyter notebook anymore. Move them into production.
Thanks for coming to my TedTalk. Adios

Comments