
Financial Reporting Series: Automating Income Statements in PowerBI for Real-Time Insights
- Abdulazeez Abdullah Temitope
- Feb 15, 2025
- 4 min read

Updated: Aug 11, 2025
Financial statements form the basis of decision-making. However, many organizations fail to prepare these crucial documents on time and accurately. Companies that postpone financial statement preparation till the last minute frequently experience rushed operations, inaccuracies, and missed opportunities for proactive financial management. This issue is worsened by the absence of real-time tracking throughout the year. However, with the introduction of automated technologies such as Power BI, businesses can now streamline this process to ensure accuracy, efficiency, and timely insights. This article investigates how using Power BI can change the way income statements are prepared, providing a solution to the recurrent issue of last-minute financial reporting.
A conversation with a friend highlighted a critical issue faced by many organizations: the delay in preparing financial statements. Most companies tend to compile their financial records towards the end of the fiscal year, resulting in a disorganized attempt to reconcile finances, identify missing entries, and rectify errors. This reactive approach not only increases the risk of inaccuracies but also leaves little room for strategic decision-making. Automated financial reporting, however, can reduce these challenges by providing real-time insights and enabling proactive measures.
To understand how automation can help, it’s essential to first grasp the foundational elements of financial reporting: the Chart of Accounts and General Ledger Entries.
Chart of Accounts: This is a structured list of all accounts used by a company, organized by categories such as assets, liabilities, revenue, and expenses. It serves as the backbone of financial reporting, ensuring that all transactions are properly categorized.
General Ledger Entries: These are the individual financial transactions recorded in the general ledger. They provide a detailed record of all financial activities, which are later summarized in financial statements.
These two components are critical for generating accurate income statements. Without them, financial reporting would be chaotic and unreliable.
Creating an Income Statement in Power BI
With the foundational elements in place, the next step is to create an income statement in Power BI. Here’s what you’ll need:
Chart of Accounts

General Ledger Entries

Income Statement Template Mapped to Your Chart of Accounts

Download sample data here.
Building the Data Model
This starts with importing those ingredients into Power BI. The data model is relatively straightforward: the Chart of Accounts is related to the General Ledger Entries through the account number. This relationship ensures that all financial transactions are accurately reflected in the income statement.

Taking a look at the income statement template, there are several sub-totals and totals with no associated account such as Total Revenue, Total COGS, Total Gross Profit, Gross Profit %, Total Other Expenses, Total Net Profit, and Net Profit %.

Individual DAX measures would have to be written for them.
Ledger Amount

Total Revenue

Total COGS

Total Gross Profit

Gross Profit %

Total Other Expenses

Total Net Profit

Net Profit %

Now we have created all the individual measures. We need to reference all these measures in a single DAX measure that also calculates each line item in the income statement template

Designing the Income Statement
With the data model and DAX measures in place, the next step is to design the income statement in Power BI. Here’s how:
Create a table visual that includes the row index and income statement items from the template. Ensure that the row index is set to “Don’t Summarize” and that “Show Items with No Data” is enabled.

In your format pane, search for "wrap" and ensure all text wrap is turned off

Move the row index to the left so as to hide it
Add selected year actuals measure to the table

Add year slicer to your report page and you are ready to go.
Finally, design the report to ensure it is visually appealing and easy to interpret.
Leveraging Power BI’s Time Intelligence
One of the most powerful features of Power BI is its time intelligence capabilities. With PowerBI, you can compare current year performance with the previous year, calculate growth rates, and gain deeper insights into financial trends. To do this, we need the following:
Ledger Amount LY
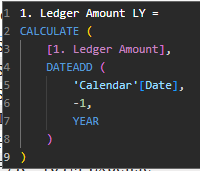
Total Revenue LY

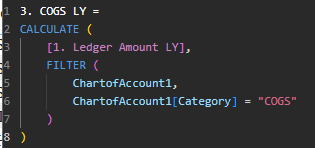
Total COGS LY
Total Gross Profit LY

Gross Profit % LY

Total Other Expenses LY

Total Net Profit LY

Net Profit % LY

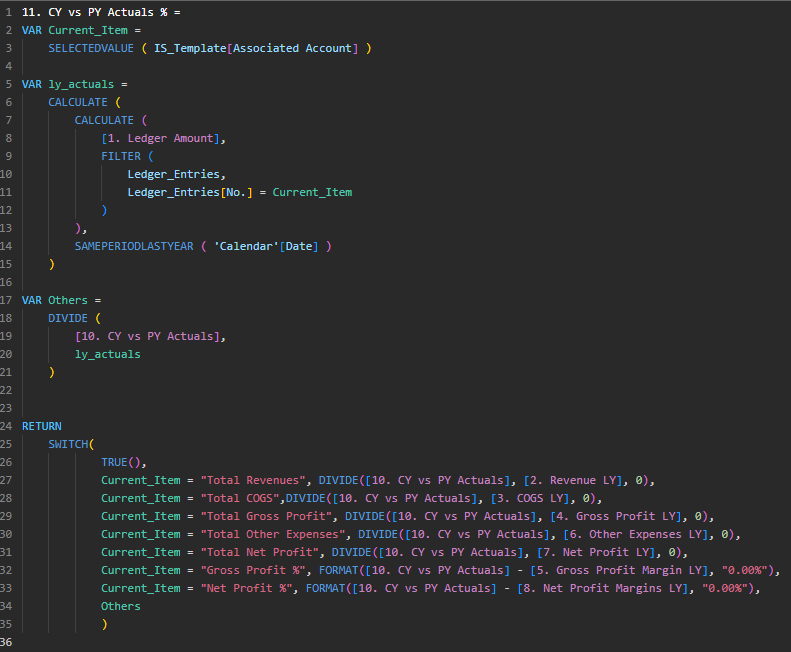
Previous Year Actuals

The following measures allow you to calculate the difference between the current and previous year, as well as the growth rate for each line item. This knowledge is crucial for assessing long-term financial performance and making educated decisions. 10. Current Year vs Previous Year Difference

Growth Rate
Let's see how this works
See the full report here
Publish the report to the Power BI service, schedule a data refresh, and by completing these steps, you will have fully automated your income statement.
The traditional approach to financial reporting, waiting until the end of the fiscal year to compile statements, is filled with challenges. However, by leveraging Power BI, organizations can automate the process, ensuring accuracy, efficiency, and real-time insights. With a well-structured data model, carefully crafted DAX measures, and the power of time intelligence, financial managers can generate income statements in minutes rather than days. This not only saves time but also empowers businesses to make proactive, data-driven decisions. The future of financial reporting is here, and it’s automated.
At TA Insight HUB, we are your trusted Microsoft Partner for business intelligence, analytics, automation, FP&A, and budgeting. Our expertise in tools like Power BI ensures that your financial reporting processes are streamlined, accurate, and future-ready. Reach out to us today at bifola@tainsighthub.com to transform your financial operations and discover the full potential of your data. Let’s build a smarter, more efficient future together.


Comments