
From Grumpy Customers to Happy Clients: How Data Solved Zentel's Service Nightmare
- Abdulazeez Abdullah Temitope
- May 1, 2024
- 7 min read

Updated: Jul 9, 2024

I had the opportunity to review submissions for the Datafest Africa program. Inspired by some of the entries, I'm outlining a detailed approach to tackling a business problem for Zentel Network, a service centre receiving daily customer complaints across various branches. Customers expect prompt responses and resolutions, with some having Service Level Agreements (SLAs) guaranteeing a specific turnaround time. Managers and operators address these issues, and performance is measured regularly.
Background info
Zentel Network has SLAs with clients outlining specific response and resolution times for customer tickets. These include:
A 10-second response time for all issues
Resolution within 3 hours of response
An average response time not exceeding 15 seconds
Escalation to managers for any unresolved tickets after 3 hours
Before diving into the data, we need to define clear objectives. What are we trying to achieve with this analysis? Thankfully, the goals are provided:
Get a general performance overview based on relevant metrics.
Assess a proposal to optimize turnaround time (TAT) between 6 pm and 9 pm due to customer complaints.
Identify factors causing delays in ticket response times.
Pinpoint top-performing and struggling managers/operators.
You can download data here.
Data Preparation

The following tables were loaded into PowerBI

Since the data provided is just a month’s data, there is not much need for a calendar table. The final model looks like this.

Here comes the tricky part. As much as creating charts and graphs is important, understanding the business problem is essential.
Let’s dive into the business problem a bit.

Earlier, we were told there was a service agreement between the company and its customers. Also, disgruntled customers feel the terms of the agreement aren’t being fulfilled on the customer’s end. Understanding this will then lead you to use the appropriate metrics.
Hence, your exploratory analysis should speak to helping you, the analyst, understand how Zentel is performing in fulfilling that agreement. I’ve almost maintained that the greatest tool of an analyst is their mind, not PowerBI, Excel, Python etc. The ability to ask questions and think supersedes the tool itself. The tool is just a means to an end.
In our case, questions that help you understand if and where Zentel is underperforming in terms of fulfilling the agreement include
What is the percentage of issues responded to within the agreed 10secs?
Is the average response time not greater than 15 seconds?
What is the percentage of issues resolved within the agreed 3 hours?
You can also leave it as no. of issues responded to with 10secs, but I prefer using percentages as it is easier to picture than a number. Those questions will determine what kind of DAX measure to use.
Now that we understand the business problem, let’s prepare our data.

To know the % of issues responded to within 10 seconds, we need to find the difference between the ticket open time and response time for every case. The DAX below gets that for us.

For the resolved time, a tiny detail specified can change the direction of the result. The agreement was that issues must be settled within 3 hours of response time, not ticket open time.

Although the DATEDIFF() allows you to calculate the hour difference, I discovered it is not entirely accurate, as it uses the start of the hour. This was a mistake I noticed in some of the submissions. See the sample below.

The hour difference is 1.5 hours ( 1 hour 30 minutes), but because it uses the start of the hour, the 30 minutes is ignored.
The recipe for understanding the general outlook of business performance is almost ready.

Performance Evaluation
Kindly provide a general outlook of the performance of the business based on relevant metrics.
This is just a simple exploratory analysis, and the questions we raised while understanding the business problem will help us create relevant metrics.
My approach to analysis has always been to ask the questions of what, when, where, how and why. This greatly helps in effective insight communication, which is the approach used in creating the report.
The following DAX measures will help us understand the performance of the business.

Terminated issues were excluded because it means the customer no longer needs assistance; a terminated issue is no longer on the operator’s desk and can’t be a factor in determining the operator’s performance.


Our Initial Analysis tells us that less than 20% of issues were responded to within 10secs and less than 60% were resolved within 3 hours. We are beginning to understand why customers are disgruntled.

Looking across all areas, the organization's performance falls short of expectations. The average response time (273.96 seconds) significantly exceeds the SLA target of 15 seconds. While the average resolution time (2.42 hours) meets the SLA agreements, the high escalation rate (41.53%) suggests potential technical limitations hindering efficient resolution. This is further underscored by the fact that over 50% of all tickets raised fall into the critical or fair category based on the time of resolution provided.

See the full report here.
One of the top executives is of the opinion we should optimize TAT(Turn Around Time) between 6 pm to 9 pm every day due to backlash from disgruntled customers. Do you agree?
I wouldn’t agree, and data doesn’t agree with the executive. Let’s justify my disagreement.
Turnaround time is the difference between when the issue was open and closed. Turnaround time is the difference between when an issue is opened and closed. Optimizing TAT might imply that operators have other tasks during the day, but focusing solely on customer issues between 6 pm and 9 pm wouldn't necessarily address the root cause. The executive's assumption is based on the belief that more tickets are raised during that period, but data shows otherwise.
The aim of this article is to demonstrate the process, not just reveal the results. To determine the optimal timeframe for TAT optimization, we need to identify the peak period for customer inquiries. Unfortunately, the ticket open time data isn't categorized. We need to convert it into a categorical variable to identify peak hours.

We need to find a way to make it an ordinal variable. To do this, create a new column on your service data, as seen below.

What the column is saying is this.

The data clearly shows that optimization should be done between 8 am and 3 pm.

Even though a lower percentage of tickets are raised between 6 pm and 9 pm, they still partially meet the SLAs. Additionally, the volume of tickets raised during this time is lower compared to other periods.

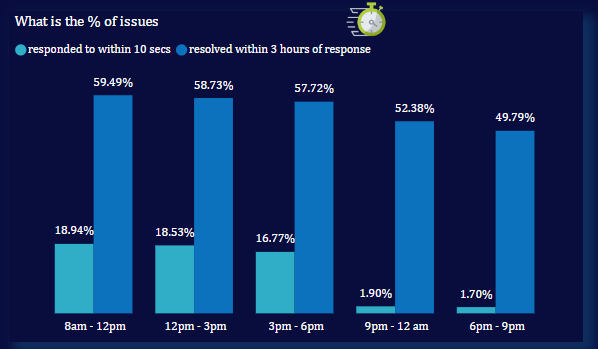
By focusing resources between 8 am and 3 pm, we can address a higher volume of tickets while still maintaining SLA compliance for the evening hours.
Based on SLA, issues are meant to be responded to within 10 seconds after they are raised. What are the key factors leading to a delay in ticket response time?
Zentel Network strives to deliver exceptional customer service as outlined in their Service Level Agreements (SLAs). A crucial aspect of this service is prompt response times. However, our analysis revealed a gap between their commitment (10-second response time for all issues) and reality (average response time significantly exceeding this target). Let's explore the key factors contributing to this delay, leveraging the insights from "Key Influencers" within the data (as shown in the image below)

The image above depicts "Key Influencers," which are variables in the data that significantly impact ticket response times. Based on this data, two key influencers emerge:
Channel: The channel through which a customer contacts Zentel appears to be a major influence. Social media, for instance, has a high volume of tickets raised, but a low response rate within the 10-second SLA window.

The high volume of social media inquiries with low response rates suggests potential inefficiencies in handling these interactions. Dedicated staff might be overloaded, or the current monitoring and response processes might be cumbersome. Additionally, the technology used for social media management might not be optimized for quick response.
Fault: Whether the fault lies with the customer or Zentel Network also seems to play a role. While the specific details aren't available, this influencer might indicate a difference in how quickly issues can be addressed based on the cause.

The influencer for "Fault" highlights a potential knowledge gap. Zentel customer service representatives might require additional training to effectively address certain customer-induced issues compared to issues originating on their end.
Which Managers and operators are performing well, and which are struggling to meet up with the required resolution Time?
For evaluating manager and operator performance, the average resolution time isn't the most effective metric. Consider the following scenario,

Mr A and Mr B both worked on ten different issues. Before the 10th issue, Mr A’s average time to resolve the problem was 0.8 hours, while Mr B had an average time of 2.2 hours. Let's say the 10th issue for Mr A is complex and takes an extended time to resolve, significantly affecting his overall average. In this case, Mr. B might appear to be underperforming based on average resolution time, even though he consistently resolved his previous issues within the stipulated timeframe.
A more effective measure would be the percentage of issues resolved within the SLA window (3 hours in this case). This approach provides a clearer picture of individual performance.
The analysis revealed that managers and operators are not performing well enough although on average, they are resolving tickets within the 3-hour SLA for resolution time.

A concerning trend emerged regarding response times. The average response time for each operator significantly exceeds the 10-second target, exceeding 250 seconds on average. This is further supported by the fact that none of the managers or operators are responding to more than 25% of their assigned tickets within the crucial 10-second window.

Additionally, a significant portion (35-55%) of tickets handled by each operator are escalated.

Recommendations for Improvements

Target the Peak Period (8 am - 3 pm): While the executive suggested optimizing turnaround time (TAT) between 6 pm and 9 pm, data reveals the peak volume of tickets occurs between 8 am and 3 pm. By strategically allocating resources during this timeframe, Zentel Network can ensure adequate staffing to address customer inquiries promptly and meet SLA targets.
Social Media Response Strategy: The data also highlights a low response rate for social media inquiries within the 10-second SLA window. Implementing a dedicated social media response team, streamlining social media monitoring processes, and potentially exploring social media management tools optimized for quick response can significantly improve response times on the platform.
Training for Faster Responses: Consider targeted training programs to equip customer service representatives with the skills and knowledge to handle inquiries more efficiently. This training could focus on specific customer service protocols, troubleshooting common issues, and utilizing relevant software tools effectively.
Evaluate Current Workflow: Conduct a thorough evaluation of the current workflow to identify bottlenecks that hinder timely responses e.g. streamlining processes, automating tasks where feasible, and eliminating unnecessary steps can significantly improve overall efficiency.
Address Knowledge Gaps: The "Fault" influencer suggests potential knowledge gaps among customer service representatives. Develop training programs to address these gaps and ensure representatives are equipped to handle various customer issues effectively.
Technology Investment: Explore potential technology investments that could enhance customer service efficiency. This could include tools for faster social media response, improved communication channels, or automation software for specific tasks.
Customer Communication:** Develop clear and effective communication strategies to enhance customer engagement, especially on social media platforms. This could involve setting expectations regarding response times, providing updates on ticket resolution progress, and exploring the use of chatbots for handling basic inquiries.
By implementing these recommendations, Zentel Network can bridge the gap between its SLA commitments and the current reality. Focusing on improving response times, optimizing workflows, and addressing knowledge gaps will allow Zentel Network to deliver the exceptional customer service experience its clients deserve.

Adios


Comments